Reporting
Additionally to a comprehensive selection of standard reports, HRlab offers various evaluation options easily customized to your company’s individual needs. This enables a holistic overview of the current situation and provides the foundation to high-quality decisions.
Cloud-based
Thanks to cloud technology (SaaS), HRlab is ready to use in no time, intuitive to handle, and adapts flexibly to your HR processes.
Focus on SMEs
HRlab is tailored specifically to small and medium-sized enterprises as well as growing businesses with up to 2,000 employees.
Maximum Data Security
HRlab is hosted exclusively in high-security data centers in Kempten and Berlin – ISO-certified and 100% GDPR-compliant.
Reliable Data
A comprehensive reporting is crucial for the decision-making process. This requires a well-structured database, reliable numbers and customizable evaluation options.
Flexible Evaluation
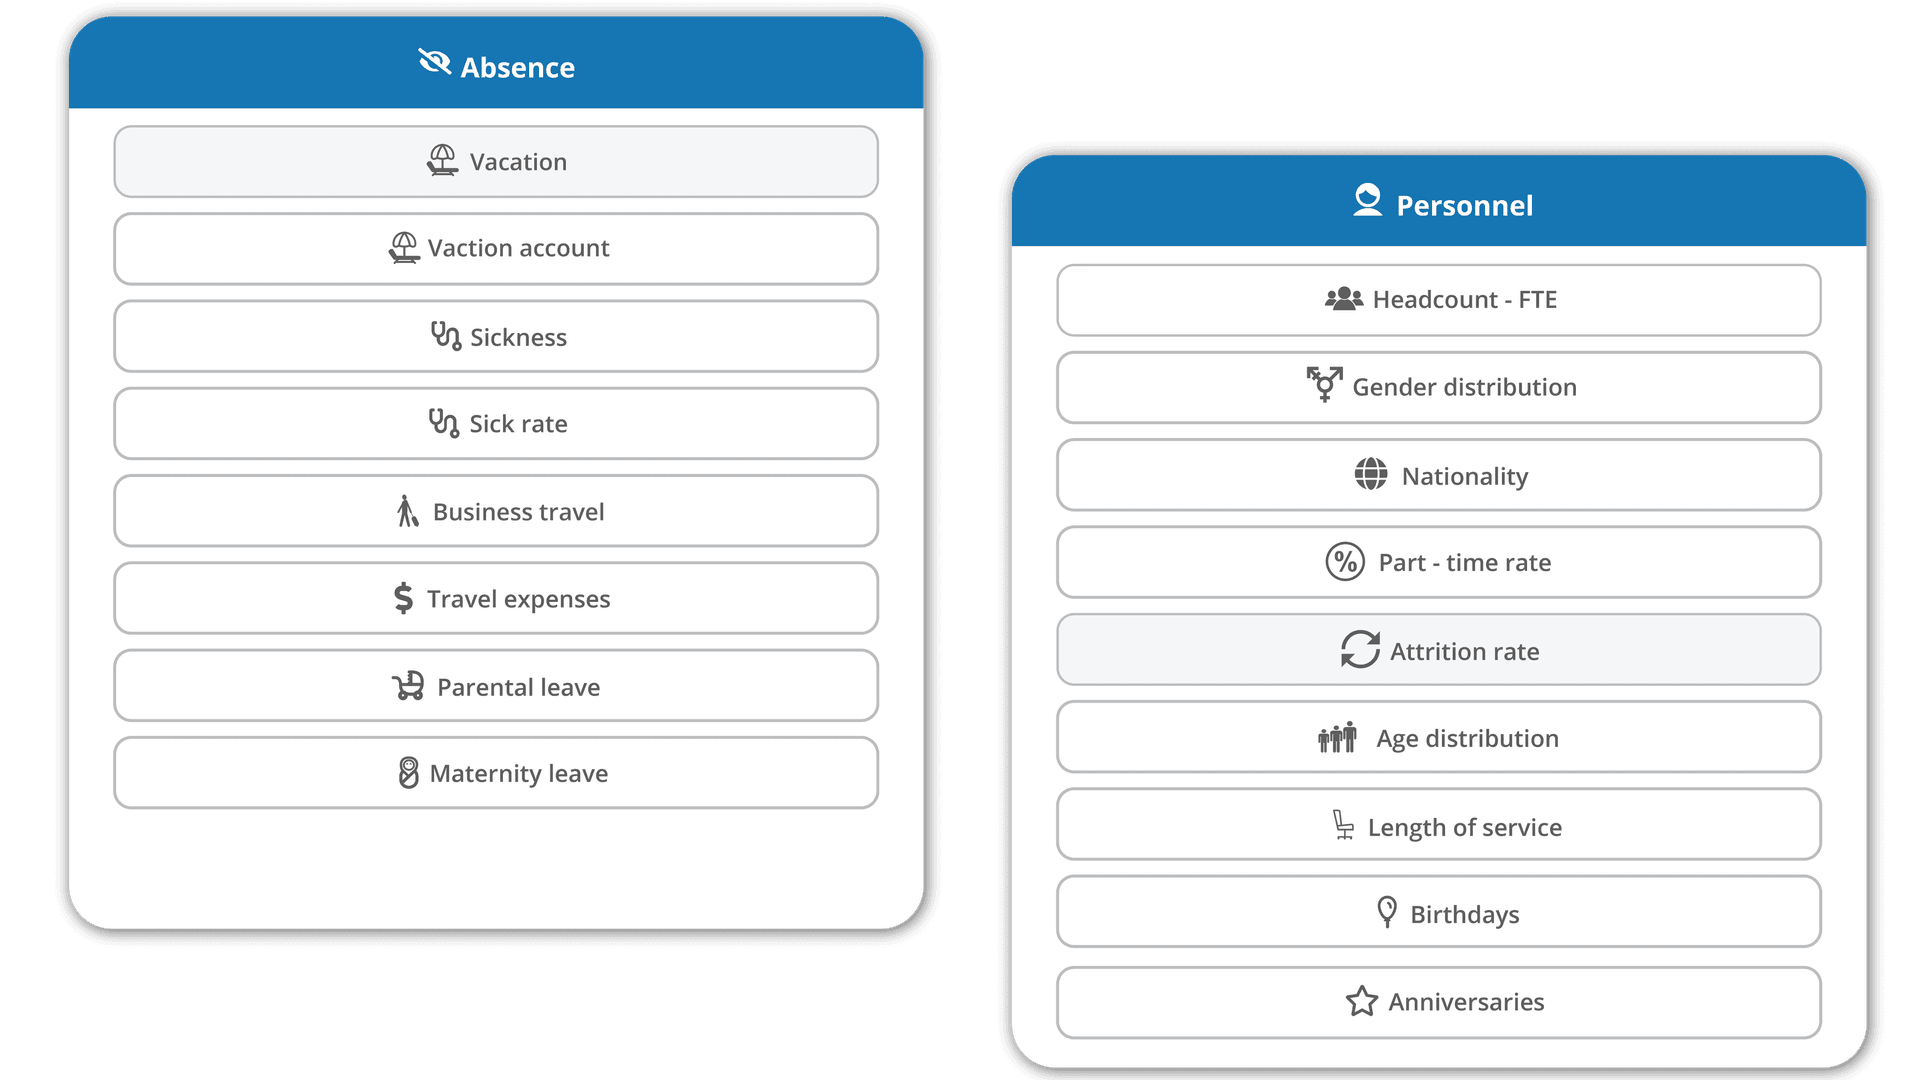
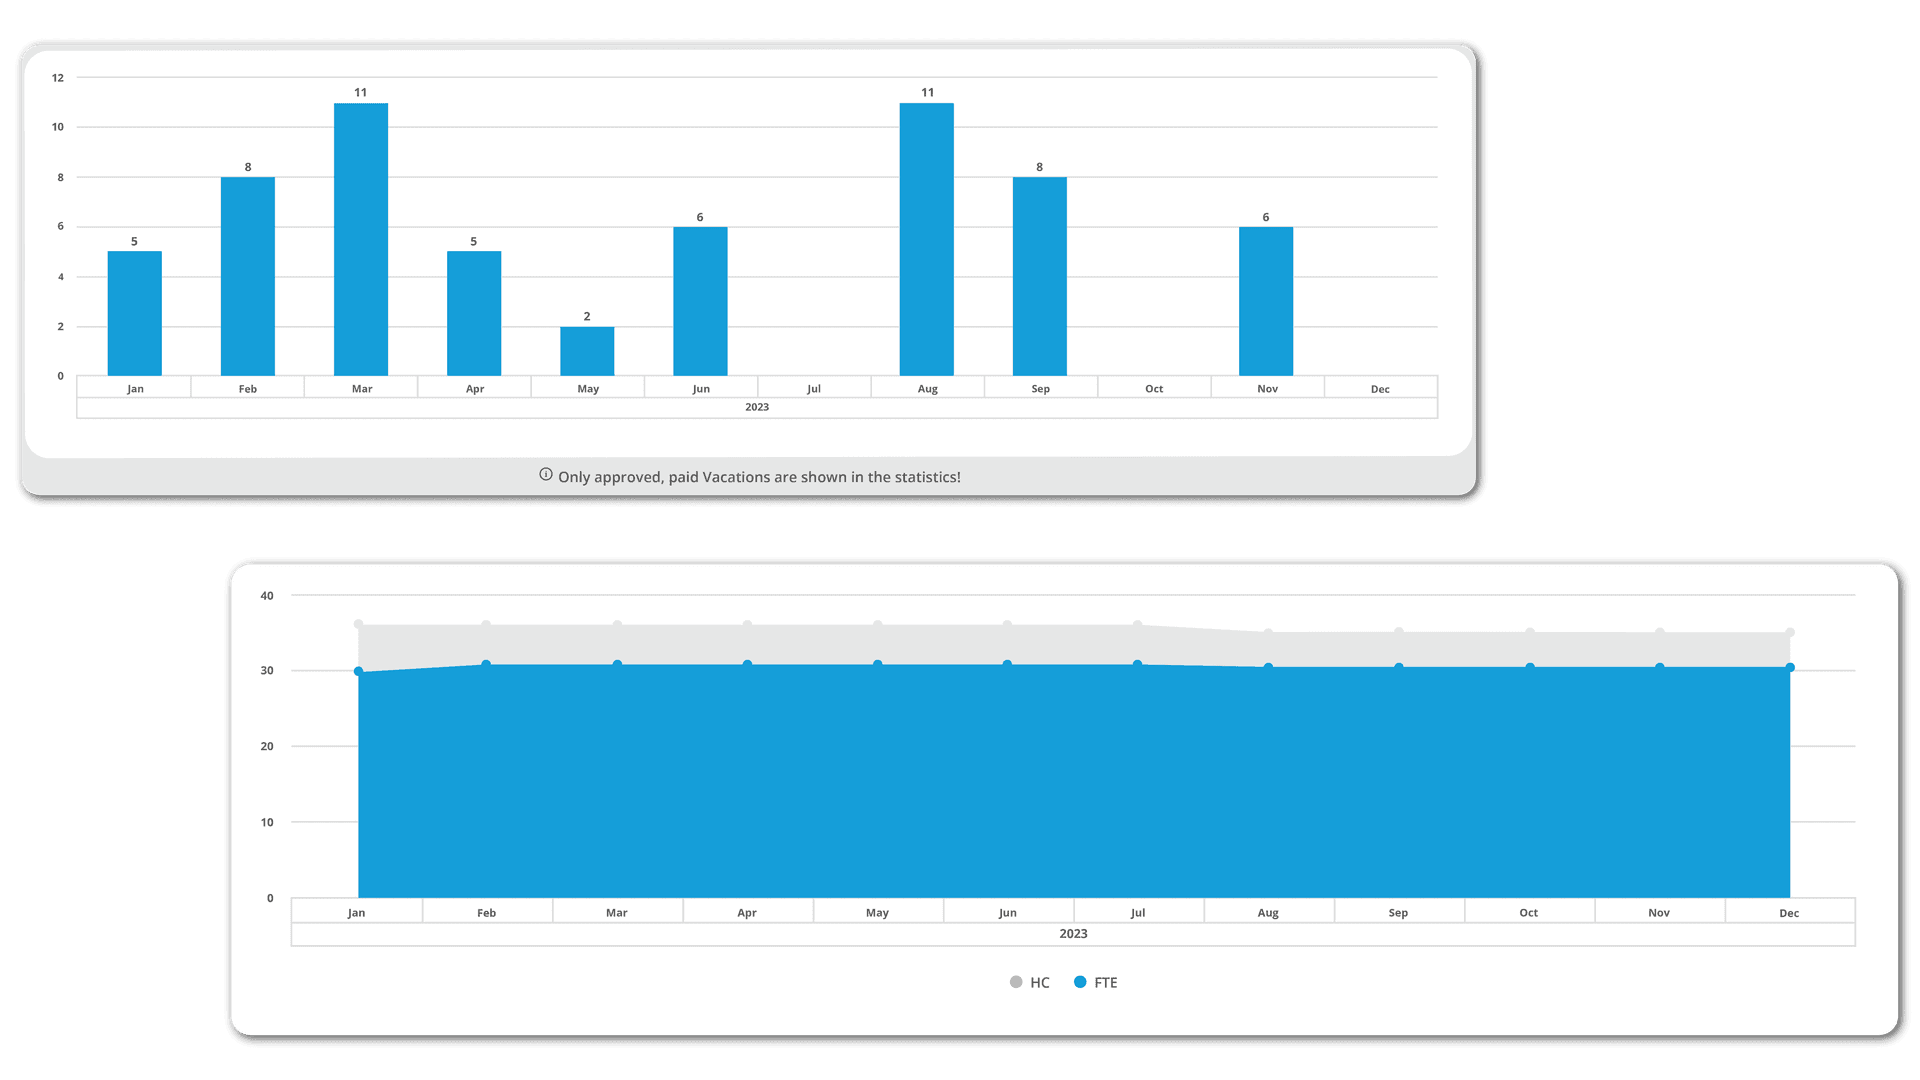
HRlab offers a wide range of standard reports for absences, personnel and remuneration structure as well as the option to evaluate existing datasets based on personal preferences. From salary trends to any sort of forecasts.
Real-Time Data
You can save frequently used queries and thus easily call them up again at a later time with real-time data. Depending on access rights, reports can be flexibly called up and exported. This way company data is just one click away for HR.
FAQ
Who has access to the reports?
Access depends on the position in the company and the assigned role. While employees have limited access to personnel-related developments and reports, HR managers can choose from a wide range of evaluations.
Can standard reports be customized?
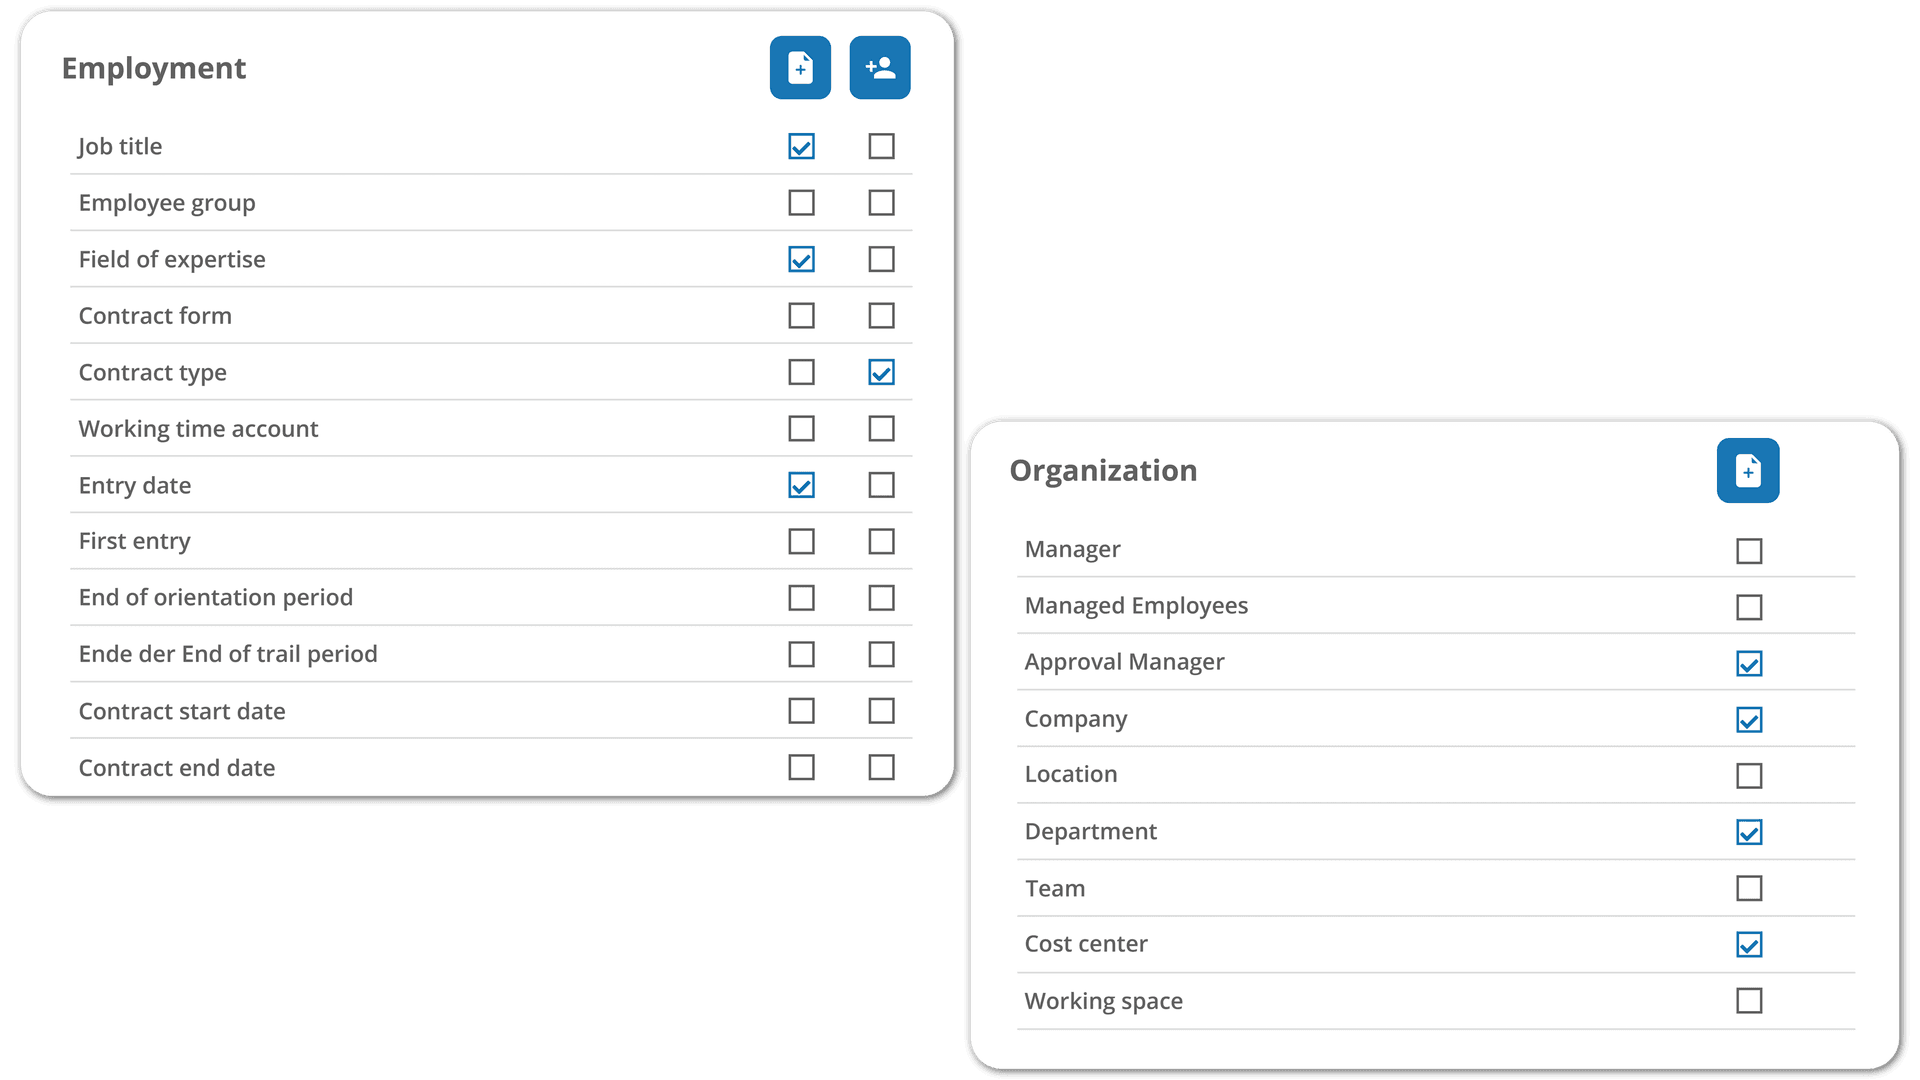
Yes. Standard reports on various topics can be accessed with one click and easily customized using a filter. Flex Reports provide further customization, allowing for complete flexibility in assembling and configuring reports.
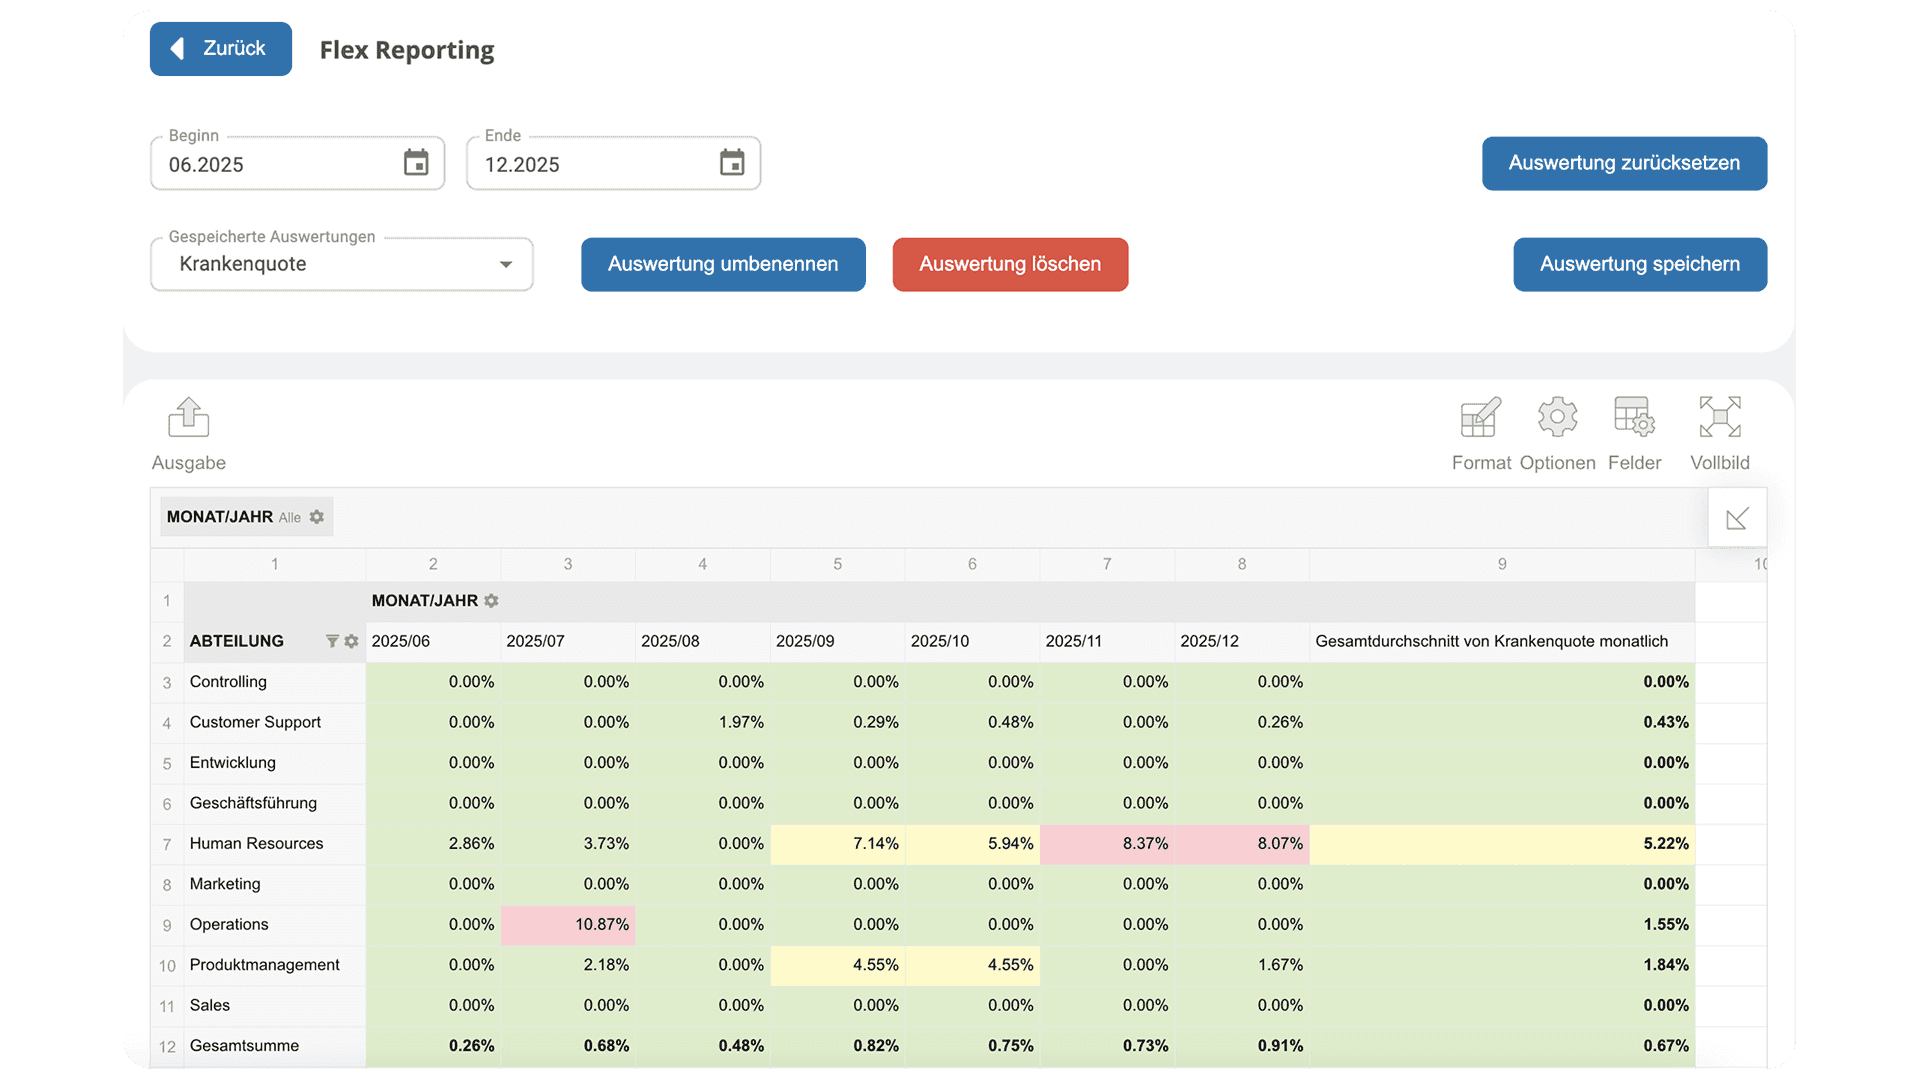
How do I create a Flex Report?
In the Reporting section, select Flex Reporting. This will automatically open a tabular view based on pivot tables. You can then flexibly choose the key metrics you want to analyze. Additionally, you can format the resulting evaluation to highlight critical values at a glance, such as using color codes.